The Iowan Brood
17-year Brood III, the Iowan Brood, emerges in Missouri, Iowa and north western Illinois. In many areas, it is in close contact with 13-year Brood XIX. This brood includes the species Magicicada cassini, Magicicada septendecim, and Magicicada septendecula.
In the map below, cicada symbols are verified presence records and red symbols are verified absence records in our database as of March 2025. Click on points for details. Gold symbols are from Simon (1988); smaller symbols are records with a lower degree of certainty and black crosses represent records that are considered spurious. Blue symbols are from Marlatt (1923); smaller symbols are records with a lower degree of certainty and question marks represent records that are considered spurious. Purple symbols and shading are from Stannard (1975); the eastern portion of Stannard’s Brood III is now known to be Brood XXIII. Symbols are in layered in the order Database, Simon, Marlatt, Stannard and symbols in the upper layers may obscure symbols in lower layers. Some absence records in the database are not shown for clarity. Note that the dates shown do not represent dates of adult emergence; rather, they represent dates on which choruses were active. Thus, in any given area, adult emergence may have occurred a week or more earlier than the dates shown on this map. This map may not be reproduced without written permission.
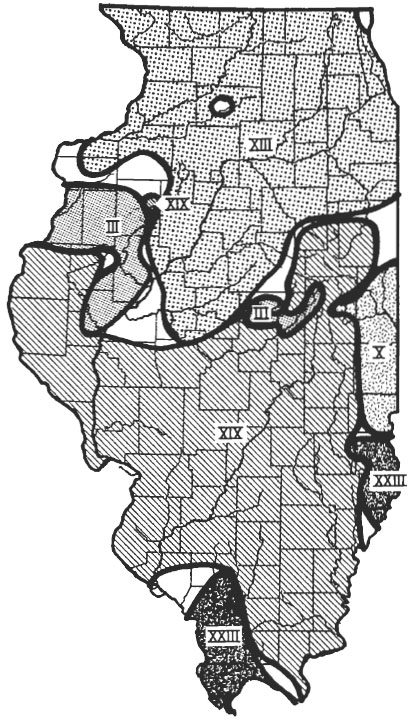
Illinois presents a particular challenge for understanding periodical cicada biology, because it contains both 13 and 17 year life cycles, all 7 currently recognized species, and five separate broods, some of which include disjunct populations.
Stannard (1975) published a map of all Illinois periodical cicada broods. Stannard’s map shows an eastern disjunct of Brood III in DeWitt, Piatt, and Champaign Counties. However, these populations belong to 13-year Brood XXIII and occupy a more restricted area than suggested by Stannard’s map.